

Quasarke Forums
  • Communities
  • Multi-communities
  • Support Lemmy
  • Search
  • Login
Climate@slrpnk.netbybeep@piefed.world
3 days

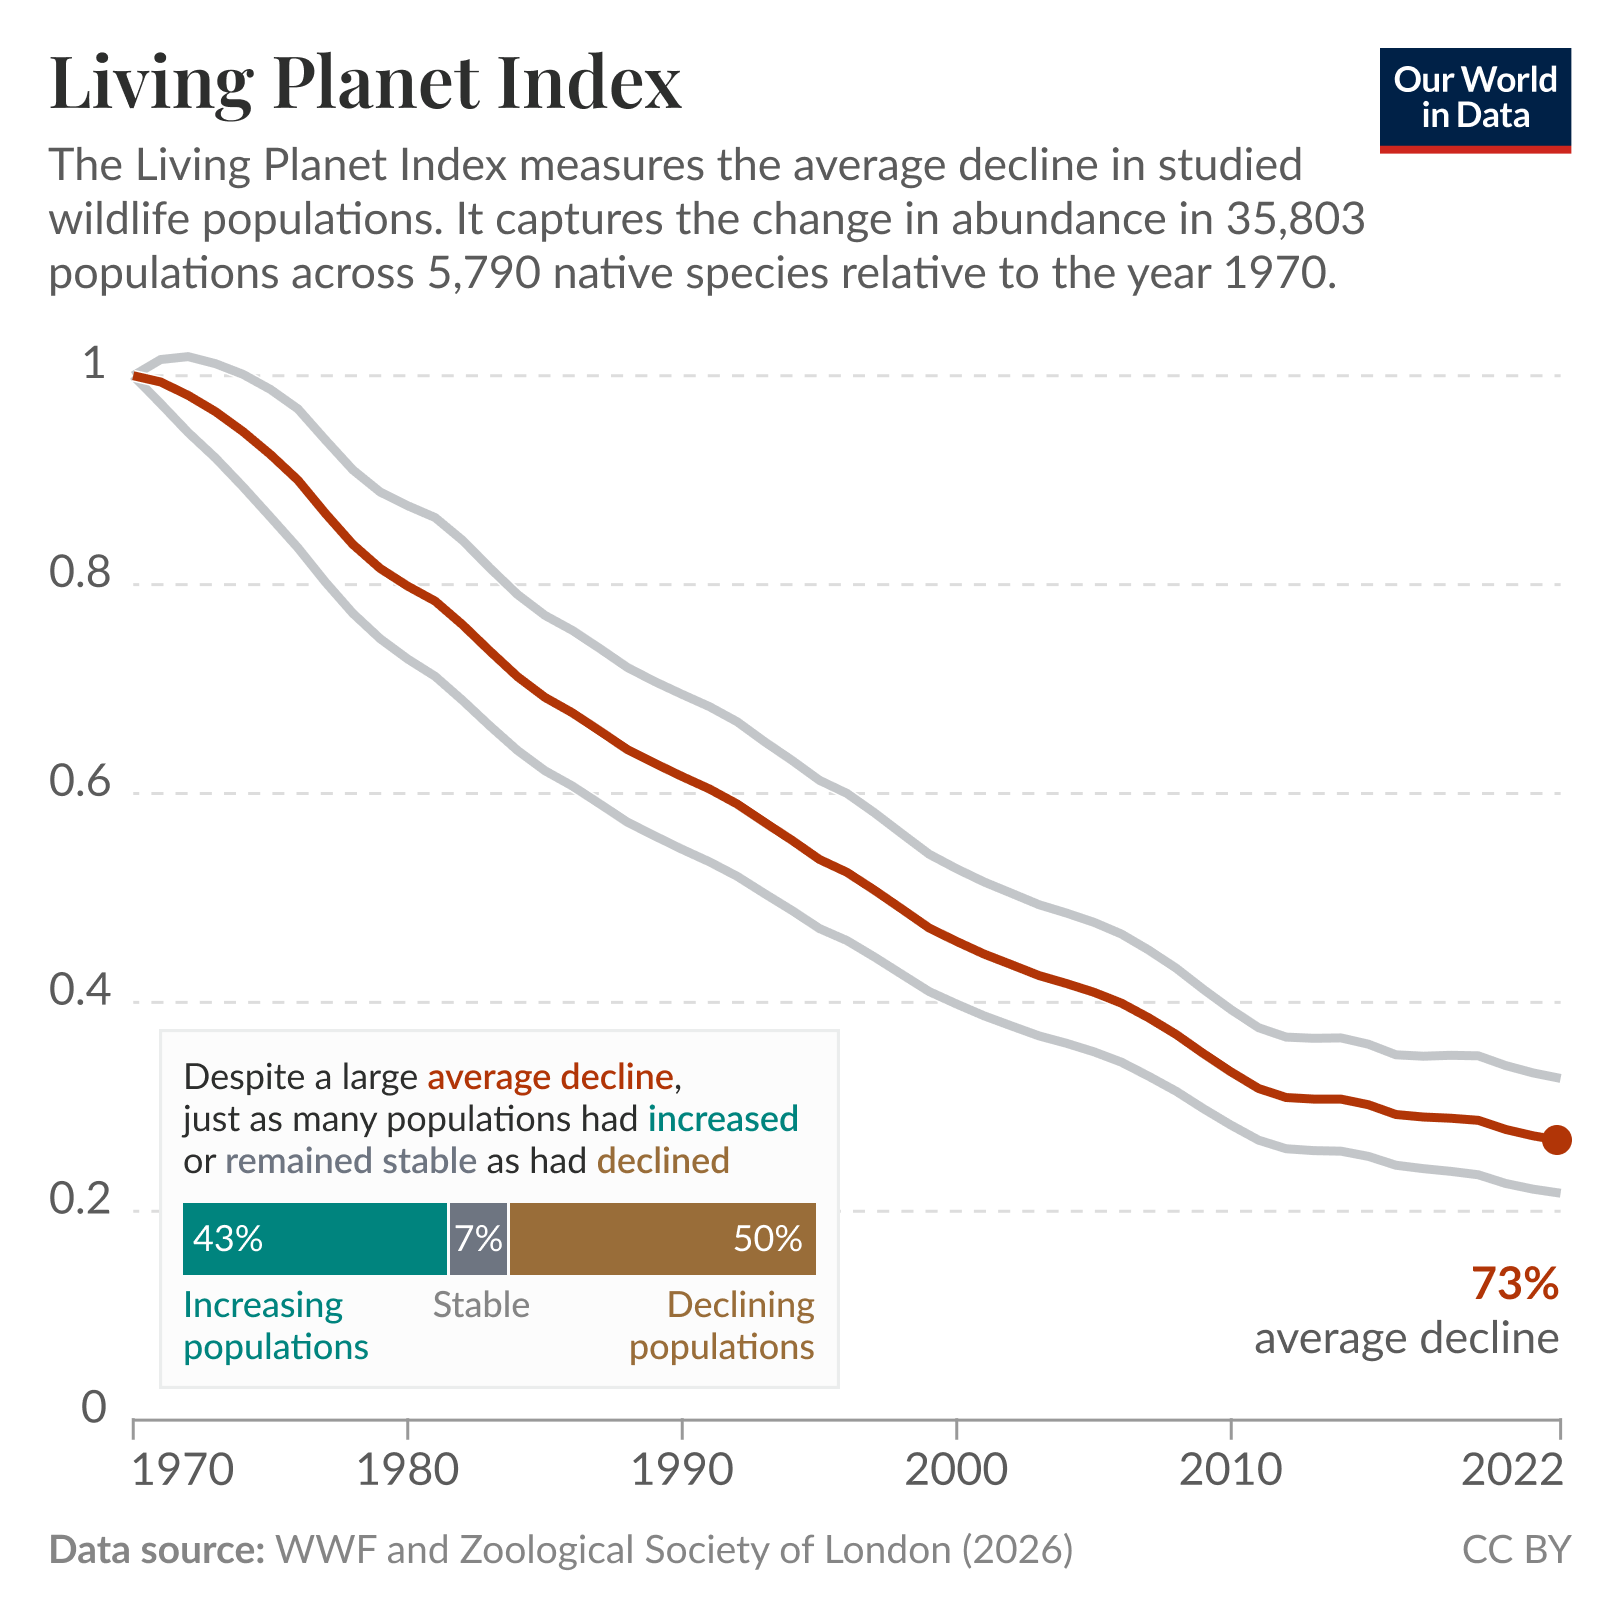
Living Planet Index 2026: 73% average decline in wildlife populations

ourworldindata.org English

cross-posted from: https://piefed.world/c/climate/p/1454093/living-planet-index-2026-73-average-decline-in-wildlife-populations

1
    A 73% average decline in wildlife populations: an overview of the 2026 Living Planet Index report
    ourworldindata.org
    A guide to understanding the Living Planet Index and what it does and doesn’t mean.
    You must log in or register to comment.

    • Tiresia@slrpnk.net
      2 days

      As far as I can tell, the LPI is defined as such:

      • Divide the world into realms and all animals into species groups.

      • For each species, divide the realm into populations, and consider the percentage change of those populations relative to 1970. Take the mean of all percentage changes.

        • For example, if a species of bats exists in two populations, and one population went from 1000 to 0 and the other went from 10 to 100, then the species’ average change is (-100% + 900%)/2 = +400%.
      • Take the mean of species within a species group.

        • For example, If bats and deer are the only species of terrestrial mammals, and bats “went up 400%” per above while deer went extinct (-100%), terrestrial mammals “went up 150%”.
      • Take a weighted average from among realms and species group, using a weighing that is not specified.

      The fact that the LPI is down to 0.27 while half of species declined means that populations have increased mostly among species groups and locations that the authors think don’t matter as much for planetary wellbeing.

      Climate@slrpnk.net

      climate@slrpnk.net

      Subscribe from remote instance

      Create post

      Report community

      Modlog
      You are not logged in. However you can subscribe from another Fediverse account, for example Lemmy or Mastodon. To do this, paste the following into the search field of your instance: !climate@slrpnk.net

      Discussion of climate, how it is changing, activism around that, the politics, and the energy systems change we need in order to stabilize things.

      As a starting point, the burning of fossil fuels, and to a lesser extent deforestation and release of methane are responsible for the warming in recent decades: Graph of temperature as observed with significant warming, and simulated without added greenhouse gases and other anthropogentic changes, which shows no significant warming

      How much each change to the atmosphere has warmed the world: IPCC AR6 Figure 2 - Thee bar charts: first chart: how much each gas has warmed the world.  About 1C of total warming.  Second chart:  about 1.5C of total warming from well-mixed greenhouse gases, offset by 0.4C of cooling from aerosols and negligible influence from changes to solar output, volcanoes, and internal variability.  Third chart: about 1.25C of warming from CO2, 0.5C from methane, and a bunch more in small quantities from other gases.  About 0.5C of cooling with large error bars from SO2.

      Recommended actions to cut greenhouse gas emissions in the near future:

      Anti-science, inactivism, and unsupported conspiracy theories are not ok here.

      Visibility: Public

      This community is visible to everyone.

      125 users / Day366 users / Week371 users / Month373 users / 6 months42 posts40 comments1 local subscriber9.06K subscribers
      Mods: silence7@slrpnk.net
      • BE: 1.0.0-beta.2
      • Modlog
      • Instances
      • Docs
      • Code
      • join-lemmy.org